Culture and Religion
A world view where the guide for society is based on human nature,
not on ancient scriptures. Home or Topic Groups
Midwestern USA Temperature Modifications
The other web pages in this set (for the Religion of CAGW) involve a presentation of the temperatures in the 'raw' data set at GISS. There are three data sets at GISS: for raw data (with some corrections), combined data (after combining multiple records for the same location) and homogenized data (after a 'cleaning' adjustment). This web page shows the calculated difference between the raw values and the homogenized values, presented as the annual average (averaging the difference for all the months in each year having a temperature record). These charts use Jan-Dec for the months in each year. Since GISS performs seasonal averaging, with the seasons beginning in December not January, the charts sometimes show a slight change in the last year before a step change; this slight difference is due to the GISS adjustment for the next step starting in December.
There are three possible trends to observe:
If the line of the temperature differences is flat on zero then that means there were no adjustments by GISS between the raw temperatures and the homogenized temperatures.
If the trend of the line is from the upper left (positive) toward zero at the right then that means there must have been warming due to the location of the temperature measurement instrument(s), presumably due to the urban heat island effect (human activities around the instruments warmed the device(s) more than had the device(s) been located away from those activities) and so the oldest temperatures are warmed to compensate for that effect. This adjustment is clear recognition that the temperature record is corrupted (warmed) by the temperature recording methods.
If the trend of the line is from the lower left (negative) toward zero p(or positive)m at the right then the oldest temperatures were made cooler making any temperature trend in the homogenized data set at this location warmer than the raw temperatures indicated. This adjustment either increases any warming present or results in a warming trend where none was present.
Here are the differences between the annual average temperatures in the raw and homogenized GISS data ).
The following graphs are for the states in the Midwest Region, by their names in alphabetical order like this:
IL,IN,IA,KS,MI,MN,MO,NE,ND,OH,SD,WI
After each graph is a short summary of the analysis for its locations. The left column of numbers has the temperature adjustments and the right column of numbers are the 10-year averages (of anomalies) for the year at the left. The First Adj is the first adjustment in the record. The First Ave is the first 10-year average in the record. A Peak Ave is a peak (high or low) in the anomaly average while Mid Adj is a middle peak (high or low) in the annual temperature adjustment (a Mid Adj is somewhat uncommon since the typical adjustment starts either high or low and approaches zero at the end). When the adjustments are positive, the oldest raw temperatures have been increased which would be a compensation for when the most recent temperatures are too warm due to the urban heat island effect. When the adjustments are negative, the oldest raw temperatures have been decreased which would make any overall warming trend more severe or could make an overall flat or cooling trend into a warming trend. Take note of the sign of the adjustments and the temperature swings in the first half of the 20th Century.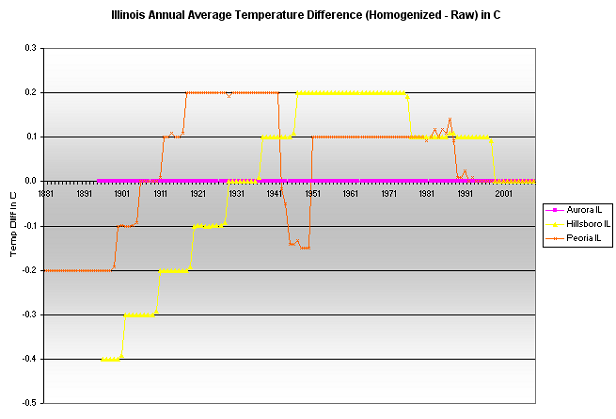
Illinois
IL Aurora
1895 First Adj 0.0
1904 First Ave 0.0 10-yr Ave -0.2
1909 Peak Ave 0.0 10-yr Ave +0.6
1918 Peak Ave 0.0 10-yr Ave -0.6
1939 Peak Ave 0.0 10-yr Ave +0.6
1958 Peak Ave 0.0 10-yr Ave -0.6
2009 Last Adj 0.0 10-yr Ave +0.6
IL Hillsboro
1897 First Adj -0.4
1905 First Ave -0.3 10-yr Ave -0.7
1939 Peak Ave +0.1 10-yr Ave +0.6
1985 Peak Ave +0.1 10-yr Ave -0.4
2009 Last Adj _0.0 10-yr Ave +0.5
IL Peoria
1881 First Adj -0.2
1890 First Ave -0.2 10-yr Ave -0.3
1895 Peak Ave -0.2 10-yr Ave -0.6
1939 Peak Ave +0.2 10-yr Ave +1.0
1948 Mid Adj -0.2 10-yr Ave +0.3
1969 Peak Ave +0.1 10-yr Ave -0.7
2009 Last Adj _0.0 10-yr Ave +0.7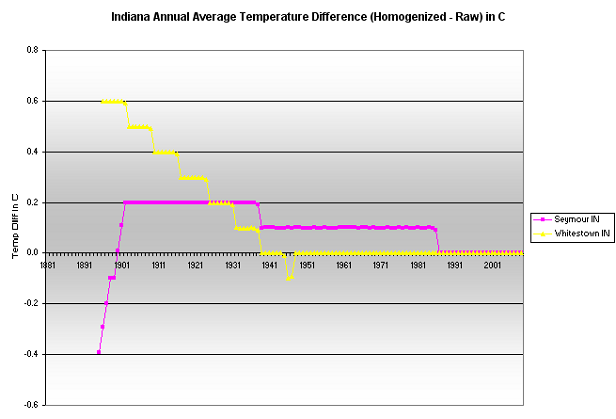
Indiana
IN Seymour
1895 First Adj -0.4
1904 First Ave +0.2 10-yr Ave -0.3
1939 Peak Ave +0.1 10-yr Ave +0.6
1969 Peak Ave +0.1 10-yr Ave -0.7
2009 Last Adj _0.0 10-yr Ave +0.5
IN Whitestown
1895 First Adj +0.6
1904 First Ave +0.5 10-yr Ave +0.2
1912 Peak Ave +0.4 10-yr Ave -0.3
1939 Peak Ave _0.0 10-yr Ave +0.4
1969 Peak Ave _0.0 10-yr Ave -0.6
2009 Last Adj _0.0 10-yr Ave +0.3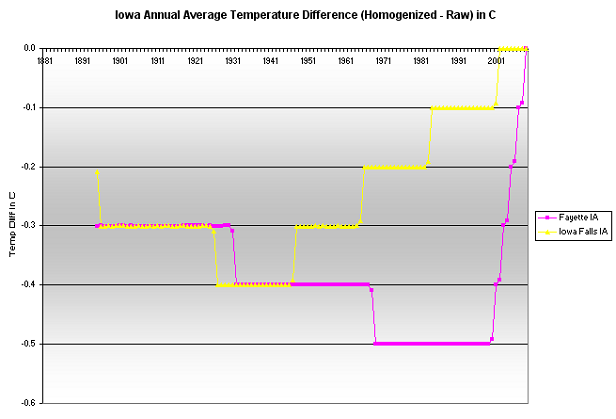
Iowa
IA Fayette
1895 First Adj -0.3
1904 First Ave -0.3 10-yr Ave -0.5
1939 Peak Ave -0.4 10-yr Ave +0.7
1985 Peak Ave -0.5 10-yr Ave -0.5
2009 Last Adj _0.0 10-yr Ave +0.7
IA Iowa Falls
1895 First Adj -0.2
1904 First Ave -0.3 10-yr Ave -0.4
1939 Peak Ave -0.4 10-yr Ave +0.5
1951 Peak Ave -0.3 10-yr Ave -0.6
2009 Last Adj _0.0 10-yr Ave +0.6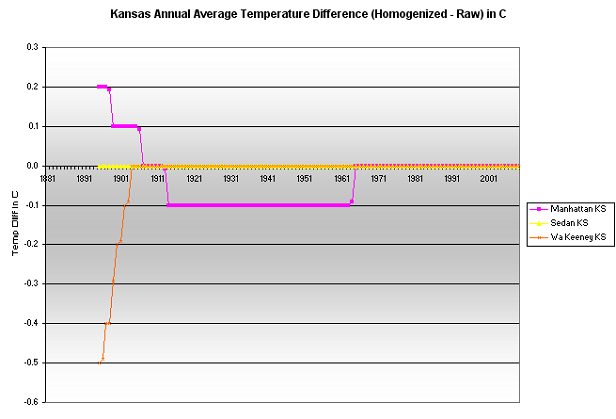
Kansas
KS Manhattan
1895 First Adj +0.2
1904 First Ave +0.1 10-yr Ave -0.2
1920 Peak Ave -0.1 10-yr Ave -0.5
1939 Peak Ave -0.1 10-yr Ave +0.7
1952 Peak Ave -0.1 10-yr Ave -0.4
2009 Last Adj _0.0 10-yr Ave +0.4
KS Sedan
1895 First Adj 0.0
1905 First Ave 0.0 10-yr Ave -0.3
1939 Peak Ave 0.0 10-yr Ave +0.8
1976 Peak Ave 0.0 10-yr Ave -0.4
2009 Last Adj 0.0 10-yr Ave +0.2
KS Wa Keeney
1895 First Adj -0.5
1904 First Ave 0.0 10-yr Ave -0.5
1939 Peak Ave 0.0 10-yr Ave +0.7
1952 Peak Ave 0.0 10-yr Ave -0.6
2009 Last Adj 0.0 10-yr Ave +0.5
Michigan
MI Coldwater
1897 First Adj 0.0
1906 First Ave 0.0 10-yr Ave -0.4
1939 Peak Ave 0.0 10-yr Ave +0.5
1967 Peak Ave 0.0 10-yr Ave -0.4
2009 Last Adj 0.0 10-yr Ave +0.5
MI Iron Mountain
1899 First Adj -0.1
1908 First Ave +0.1 10-yr Ave -0.8
1949 Peak Ave +0.1 10-yr Ave +0.3
1980 Peak Ave +0.1 10-yr Ave -0.2
2009 Last Adj _0.0 10-yr Ave +0.7
MI Owosso
1896 First Adj -0.3
1905 First Ave -0.3 10-yr Ave -0.7
1939 Peak Ave -0.2 10-yr Ave +0.6
1967 Peak Ave -0.1 10-yr Ave -0.4
2009 Last Adj _0.0 10-yr Ave +0.8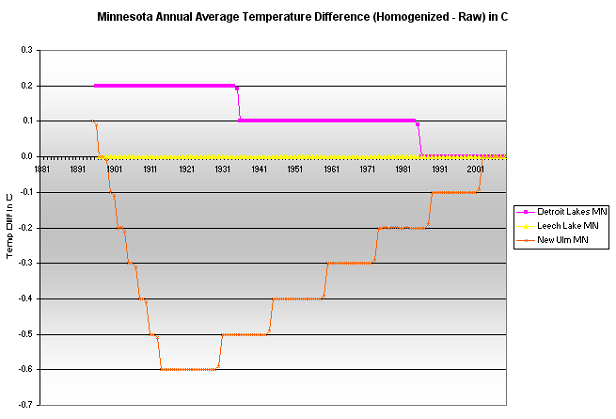
Minnesota
MN Detroit Lakes
1896 First Adj +0.2
1905 First Ave +0.2 10-yr Ave -0.2
1947 Peak Ave +0.1 10-yr Ave +0.2
1972 Peak Ave +0.1 10-yr Ave -0.6
2009 Last Adj _0.0 10-yr Ave +0.9
MN Leech Lake
1897 First Adj 0.0
1906 First Ave 0.0 10-yr Ave -0.6
1949 Peak Ave 0.0 10-yr Ave +0.2
1972 Peak Ave 0.0 10-yr Ave -0.5
2009 Last Adj 0.0 10-yr Ave +1.0
MN New Ulm
1895 First Adj +0.1
1904 First Ave -0.2 10-yr Ave -0.4
1920 Peak Ave -0.6 10-yr Ave -0.9
1939 Peak Ave -0.5 10-yr Ave +0.4
1951 Peak Ave -0.4 10-yr Ave -0.5
2009 Last Adj _0.0 10-yr Ave +1.0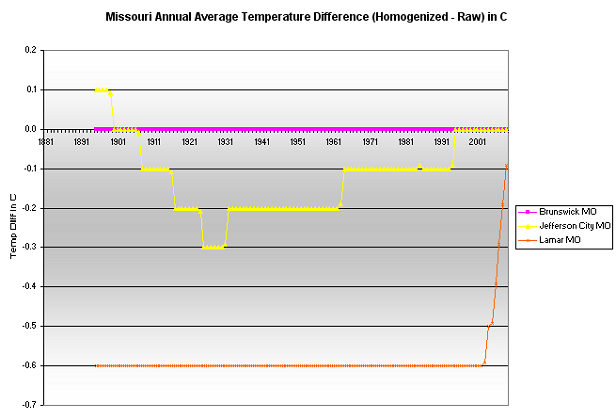
Missouri
MO Brunswick
1895 First Adj 0.0
1904 First Ave 0.0 10-yr Ave -0.3
1939 Peak Ave 0.0 10-yr Ave +0.9
1986 Peak Ave 0.0 10-yr Ave -0.5
2009 Last Adj 0.0 10-yr Ave +0.4
MO Jefferson City
1895 First Adj +0.1
1904 First Ave _0.0 10-yr Ave -0.2
1939 Peak Ave -0.2 10-yr Ave +0.4
1985 Peak Ave -0.1 10-yr Ave -0.5
2009 Last Adj _0.0 10-yr Ave +0.4
MO Lamar
1895 First Adj -0.6
1904 First Ave -0.6 10-yr Ave -0.3
1939 Peak Ave -0.6 10-yr Ave +0.7
1985 Peak Ave -0.6 10-yr Ave -0.4
2009 Last Adj _0.0 10-yr Ave +0.6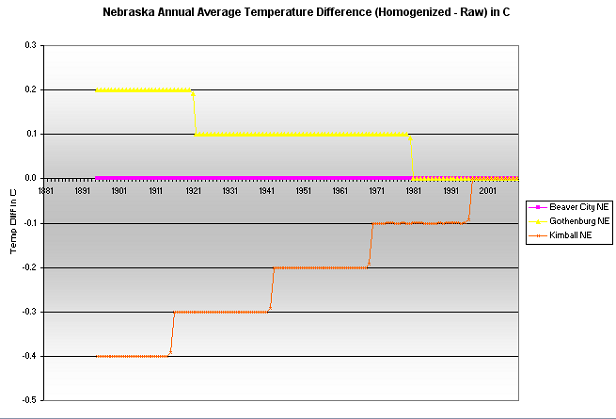
Nebraska
NE Beaver City
1896 First Adj 0.0
1905 First Ave 0.0 10-yr Ave -0.2
1940 Peak Ave 0.0 10-yr Ave +0.9
1952 Peak Ave 0.0 10-yr Ave -0.3
2009 Last Adj 0.0 10-yr Ave +0.2
NE Gothenburg
1895 First Adj +0.2
1904 First Ave +0.2 10-yr Ave -0.3
1940 Peak Ave +0.1 10-yr Ave +0.6
1951 Peak Ave +0.1 10-yr Ave -0.2
2009 Last Adj _0.0 10-yr Ave +0.3
NE Kimball
1895 First Adj -0.4
1904 First Ave -0.4 10-yr Ave -0.5
1940 Peak Ave -0.3 10-yr Ave +0.5
1951 Peak Ave -0.2 10-yr Ave -0.4
2009 Last Adj _0.0 10-yr Ave +0.7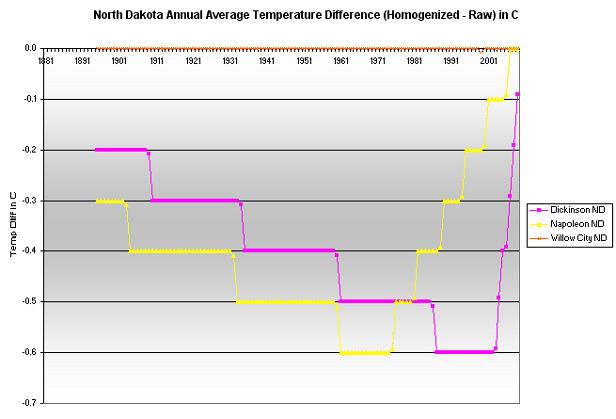
North Dakota
ND Dickinson
1895 First Adj -0.2
1904 First Ave -0.2 10-yr Ave -0.7
1940 Peak Ave -0.4 10-yr Ave +0.5
1973 Peak Ave -0.5 10-yr Ave -0.7
2009 Last Adj _0.0 10-yr Ave +0.8
ND Napoleon
1895 First Adj -0.3
1904 First Ave -0.4 10-yr Ave -0.8
1940 Peak Ave -0.5 10-yr Ave +0.5
1973 Peak Ave -0.6 10-yr Ave -0.8
2009 Last Adj _0.0 10-yr Ave +1.0
ND Willow City
1895 First Adj 0.0
1904 First Ave 0.0 10-yr Ave -0.5
1934 Peak Ave 0.0 10-yr Ave +0.5
1951 Peak Ave 0.0 10-yr Ave -0.6
2009 Last Adj 0.0 10-yr Ave +0.7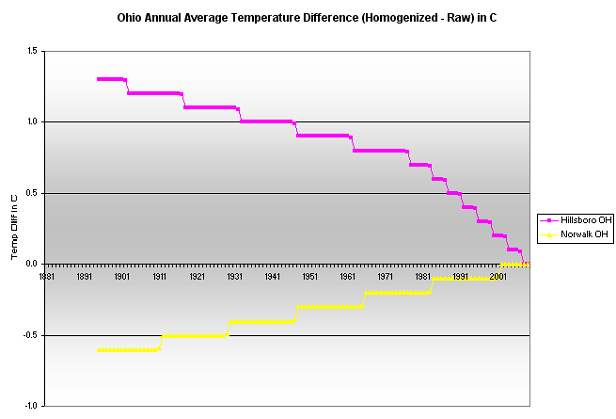
Ohio
OH Hillsboro
1895 First Adj +1.3
1904 First Ave +1.2 10-yr Ave +0.4
1939 Peak Ave +1.0 10-yr Ave +0.6
1967 Peak Ave +0.3 10-yr Ave -0.7
2009 Last Adj _0.0 10-yr Ave -0.2
OH Norwalk
1895 First Adj -0.6
1904 First Ave -0.6 10-yr Ave -0.6
1939 Peak Ave -0.4 10-yr Ave +0.5
1967 Peak Ave -0.2 10-yr Ave -0.3
2009 Last Adj _0.0 10-yr Ave +0.8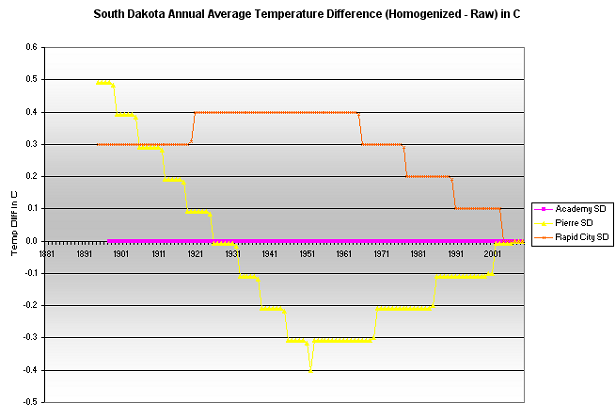
South Dakota
SD Academy
1895 First Adj 0.0
1904 First Ave 0.0 10-yr Ave -0.6
1939 Peak Ave 0.0 10-yr Ave +1.2
1951 Peak Ave 0.0 10-yr Ave -0.6
2009 Last Adj 0.0 10-yr Ave +0.8
SD Dickinson
1895 First Adj +0.5
1904 First Ave +0.4 10-yr Ave -0.2
1939 Peak Ave -0.1 10-yr Ave +1.0
1952 Peak Ave -0.4 10-yr Ave -0.9
2009 Last Adj _0.0 10-yr Ave +0.6
SD Rapid City
1895 First Adj +0.3
1904 First Ave +0.3 10-yr Ave -0.3
1940 Peak Ave +0.4 10-yr Ave +0.8
1951 Peak Ave +0.4 10-yr Ave -0.3
2009 Last Adj _0.0 10-yr Ave +0.6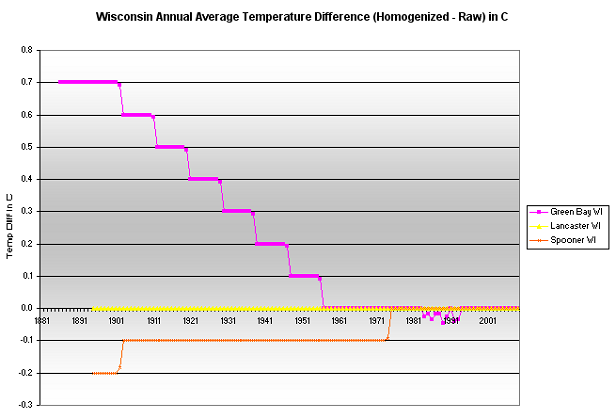
Wisconsin
WI Green Bay
1886 First Adj +0.7
1895 First Ave +0.7 10-yr Ave -0.6
1939 Peak Ave +0.2 10-yr Ave +0.8
1959 Peak Ave _0.0 10-yr Ave -0.6
2009 Last Adj _0.0 10-yr Ave +0.6
WI Lancaster
1895 First Adj 0.0
1904 First Ave 0.0 10-yr Ave -0.3
1939 Peak Ave 0.0 10-yr Ave +0.7
1979 Peak Ave 0.0 10-yr Ave -0.4
2009 Last Adj 0.0 10-yr Ave +0.5
WI Spooner
1895 First Adj -0.2
1904 First Ave -0.1 10-yr Ave -1.1
1939 Peak Ave -0.1 10-yr Ave +0.6
1972 Peak Ave -0.1 10-yr Ave -0.4
2009 Last Adj _0.0 10-yr Ave +0.7
There is a mix of locations adjusted for warming (to reduce the warming trend in the raw data set) and for cooling (to increase the warming trend in the raw data set).
Here is an analysis of the temperature record.
created - Jan. 2011
last change - 02/03/2011
Here is the list of topics in this AGW Topic Group .
All Topic Groups are available by selecting More TG.
All topics in the site are in the Site Map, where each Topic Group has its topics indented below it.
Ctrl + for zoom in; Ctrl - for zoom out ; Ctrl 0 for no zoom;
triple-tap for zoom to fit; pinch for zoom change; pinched for no zoom