Culture and Religion
A world view where the guide for society is based on human nature,
not on ancient scriptures. Home or Topic Groups
World Temperature Trends do not Conform with AGW
The discussion about Catastrophic Anthropogenic Global Warming (CAGW), or the theory that atmospheric gases generated by mankind are causing global temperatures to rise, is becoming rather uncivil. Many proponents of CAGW deny that any criticism of the theory is valid while critics of AGW are labeled as 'deniers' of 'settled science' so rarely is there a civil debate of the situation. The CAGW proponents predict many global catastrophes due to the warming temperatures caused by more CO2 (carbon dioxide) including melting ice caps, rising sea level, and various negative impacts on the plant and animal life on Earth. The CAGW proponents are strongly pushing for severe reductions on CO2 emissions by industry, which will have accompanying impacts on the world's future economic health. If this prediction for future disaster has no scientific foundation (i.e., man-made CO2 is not causing global warming) then the impacts on people and industry will have been unnecessary. The CAGW proponents have been associating just about every natural phenomenon (whether weather or ecological) over the past few decades with global warming and that unscientific fear mongering becomes tiresome. Unfortunately, it had initial traction among many (scientist or not) due to the warmer temperatures in the 1980's and 1990's so many could believe the claims of that association, regardless of whether the association was scientifically valid.
The 16 regions of the world are presented in this (random) order:
Africa, Southeast Asia, Southwest Asia, Australia, East Canada, West Canada, East Europe, West Europe, North Europe, South Europe, New Zealand, Pacific Ocean, Poles (north and south), East Russia, West Russia, South America,
The United States of America has its own topic.
The trends at sites around the world have also been analyzed. Using the 'raw' NASA GISS temperature data (not the 'combined' or 'homogenized' alternate selections among the three GISS options), an attempt was made to find several locations in each region having a complete (or very nearly complete) temperature record from the present to before 1900. This was not always successful, with many records ending around 1990. Other sites did not have a long enough record or with too many extended gaps in the record. The locations were collected into 15 regions for this world analysis. Most of the temperature data records were collected from the GISS site on January 9, 2010 when data entry for the 2009 year was not completed; however in April 2010 when 2009 data was available this analysis was updated to include that last year.
The main reason for this analysis was to check for the same trends noted in America but on a world wide scale: a warming in the early 20th century (in the 1930's) while CO2 levels were rather static (suggesting that CO2 is not related to historic rising or falling temperature trends), followed by a cooling period (in the 1960's) when the CO2 levels were increasing (a contradiction of CAGW, a proposed relationship between rising CO2 levels and rising temperatures), followed by a recent warming period (in the 1990's) when both the CO2 levels were increasing and the sun was in a particularly active phase.
This page presents a summary of that analysis. Here is a text file that lists the locations in all the regions used in this page and a few samples of the temperatures. Here is a Word document with the links to the GISS data for all the locations, as well as the latitude and longitude (from GISS) for each location.
The following graphs are for different regions of the world, with them presented in roughly a West to East order around a globe, with a sequence for each hemisphere. The start is at Australia for the Southern hemisphere toward Africa and then starting again with Canada for the Northern hemisphere toward Europe and ending in Asia.
The regions of the world are presented in this order:
Australia, New Zealand, Pacific Ocean, Poles (north and south), South America, Africa
West Canada, East Canada, West Europe, North Europe, South Europe, East Europe, West Russia, East Russia, Southwest Asia, Southeast asia.
The United States of America has its own topic.
A graph showing the annual average temperature trend for each location in that region will be shown below. This average smooths the many year to year variations at most locations to offer a trend rather than annual fluctuations. All of the charts are screen captures from the the output by Excel files which can be obtained from the author.
Unfortunately, the GISS data records are often incomplete.
Warming, cooling and warming trends can be seen while CO2 levels would have been steadily increasing.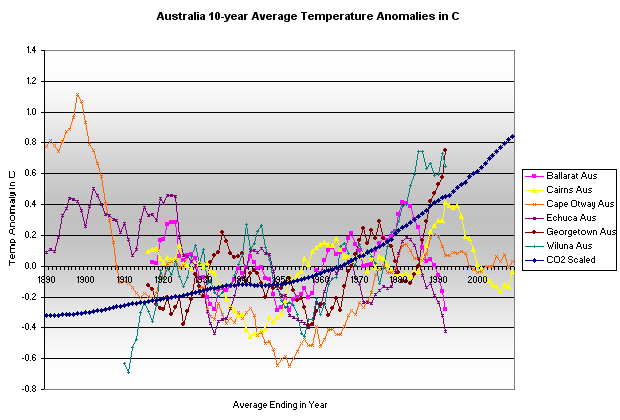
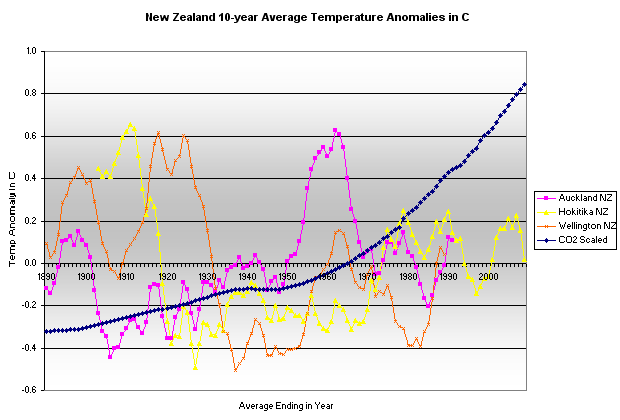
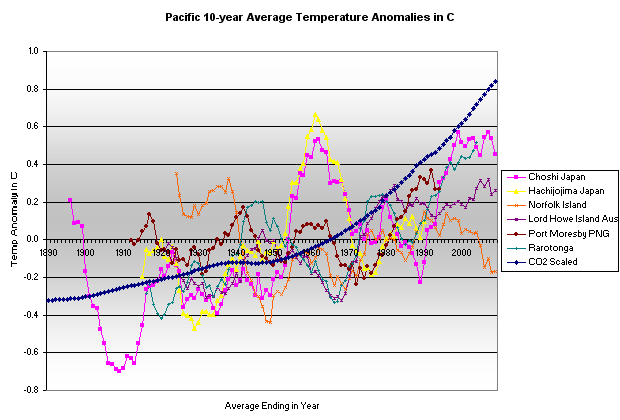
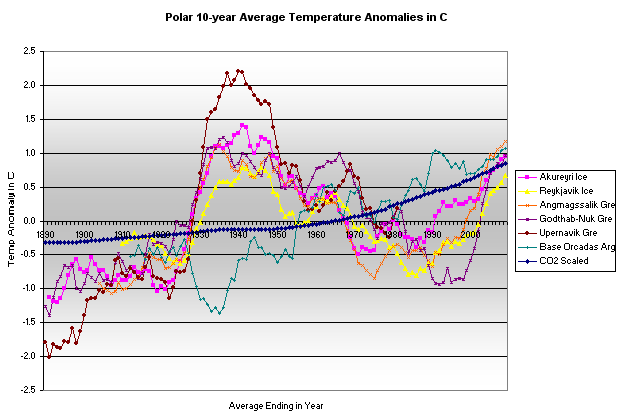
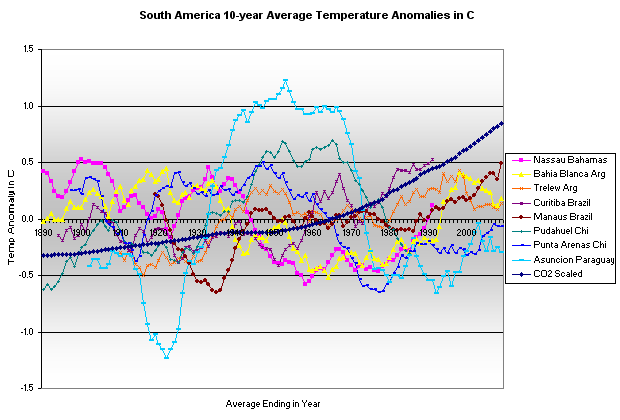
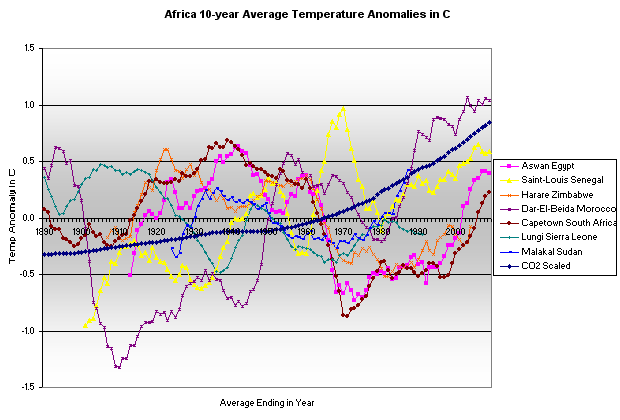
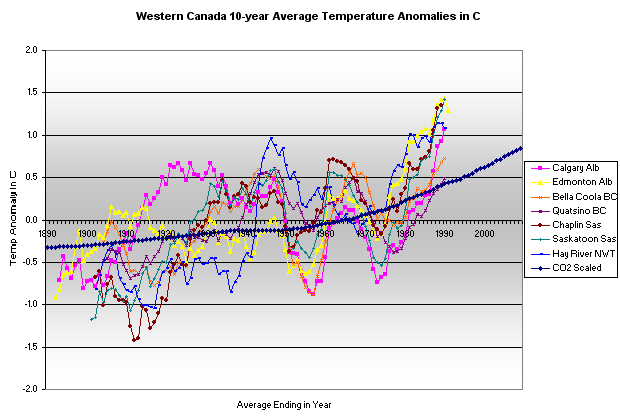
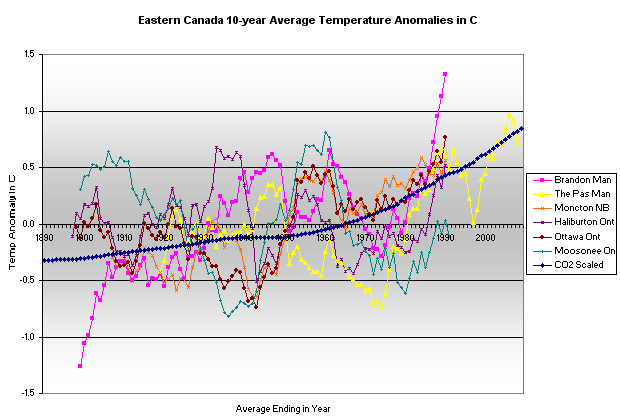
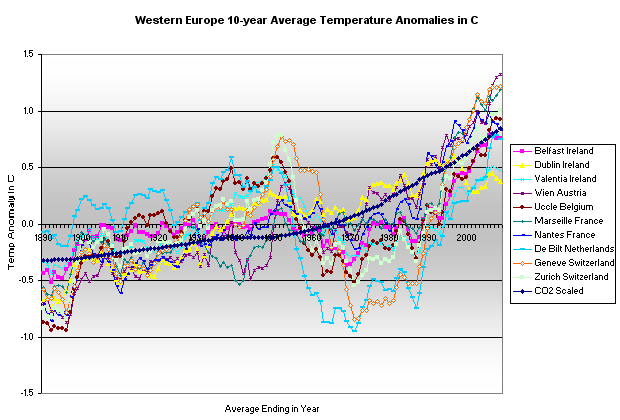
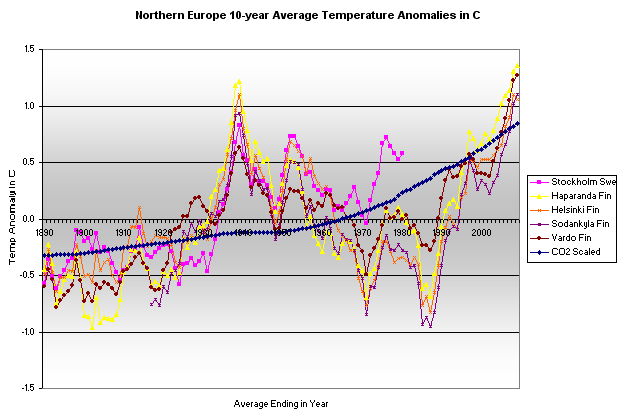
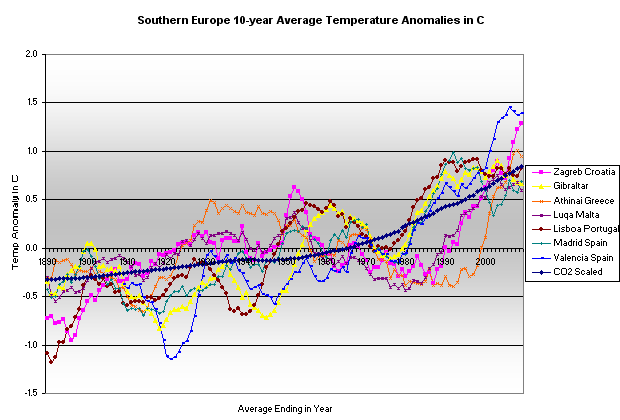
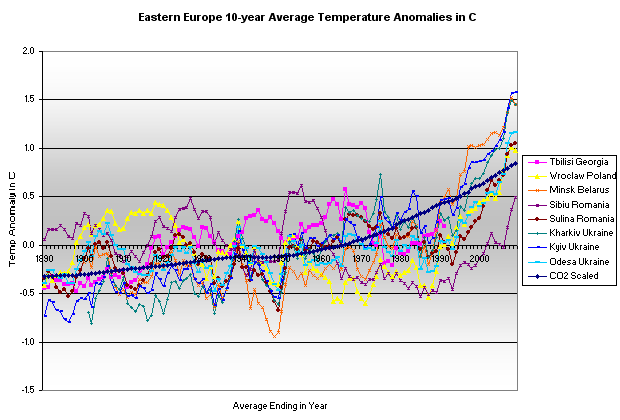
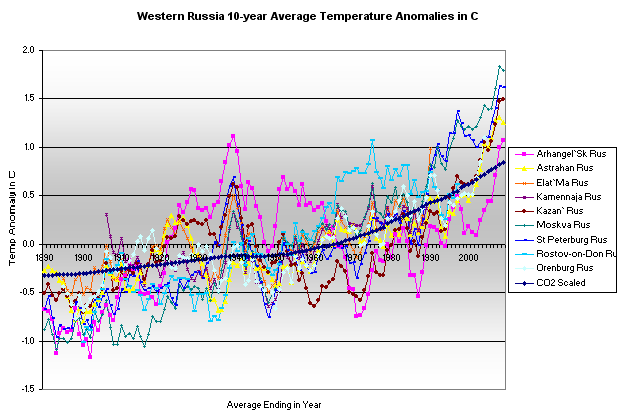
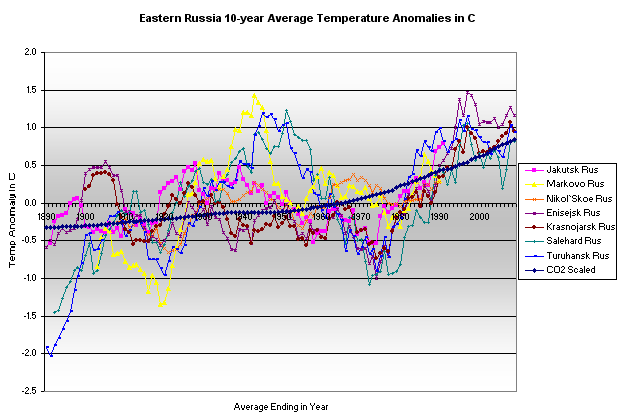
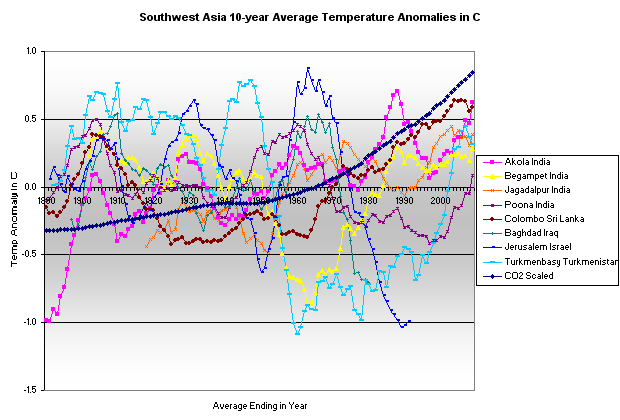
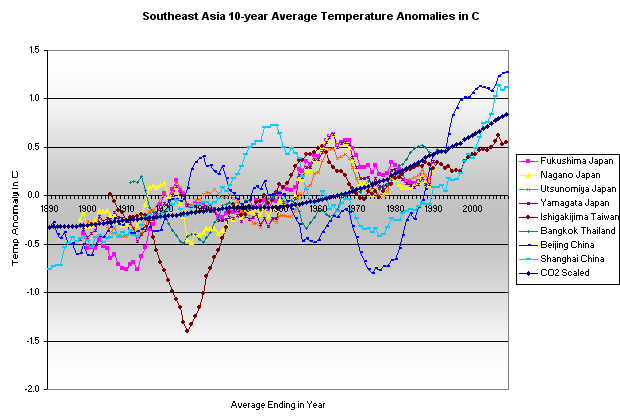
I suggest that there are no regions where the temperature trends conform to the trend in CO2 levels. There must be other significant climate factors that cause temperatures to warm and cool over spans of many years. It must be difficult to justify the claim that warming at the end of the 20th century is caused solely by increasing CO2 levels even though many regions also had warming earlier in the 20th century when CO2 levels were relatively static and that initial warming was often followed by a cooling trend even as CO2 levels started to increase at a higher rate than before (in the 1960's). Each of the regional Excel files includes a chart that compares the average temperature at one location with the solar sun spot cycle length.
created - Feb. 2010
last change - 04/11/2010
Here is the list of topics in this AGW Topic Group .
All Topic Groups are available by selecting More TG.
All topics in the site are in the Site Map, where each Topic Group has its topics indented below it.
Ctrl + for zoom in; Ctrl - for zoom out ; Ctrl 0 for no zoom;
triple-tap for zoom to fit; pinch for zoom change; pinched for no zoom