Culture and Religion
A world view where the guide for society is based on human nature,
not on ancient scriptures. Home or Topic Groups
World Solar Cycle Analysis
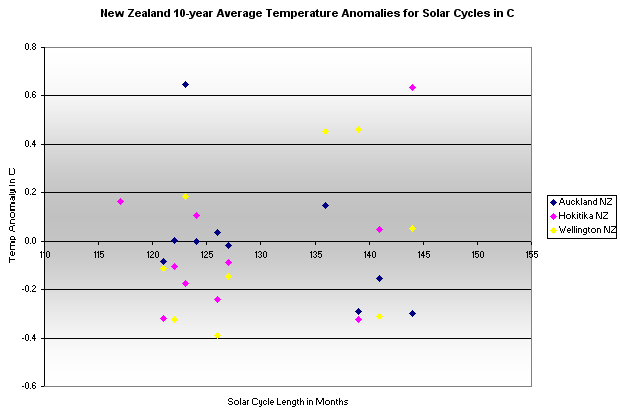
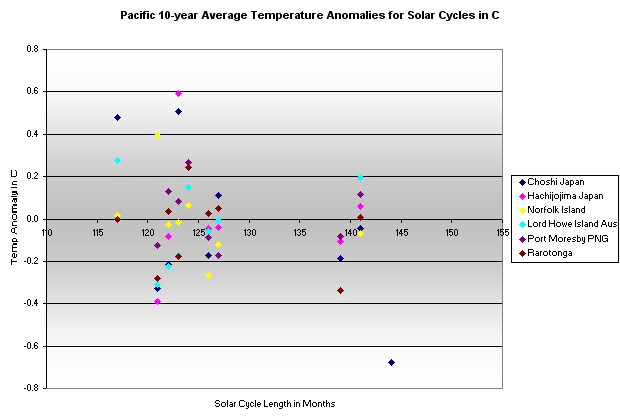
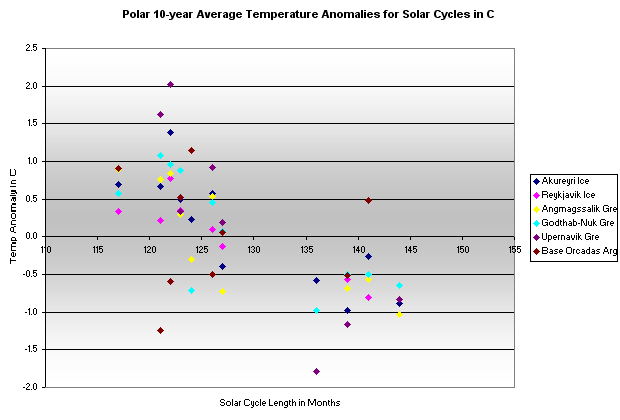
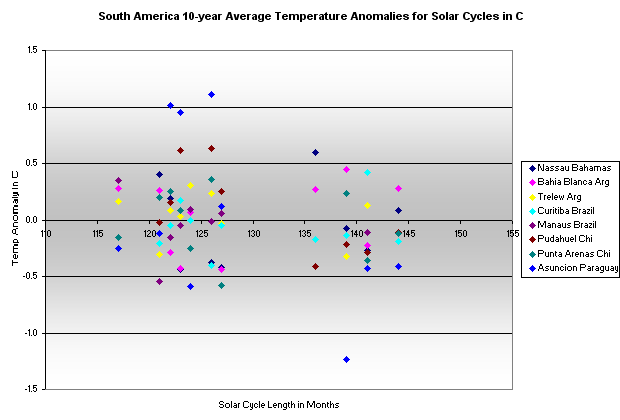
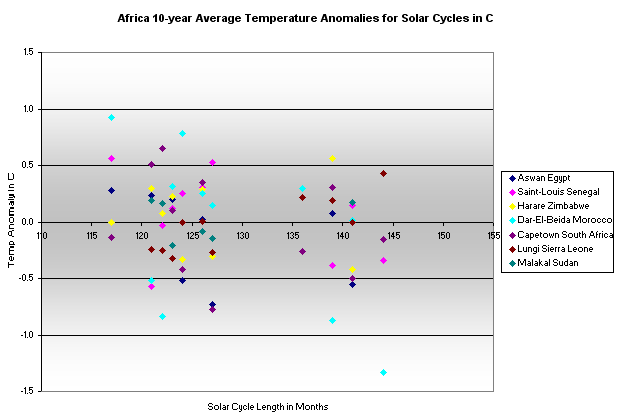
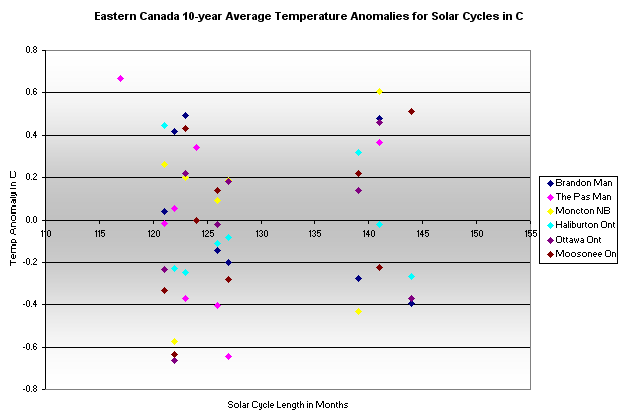
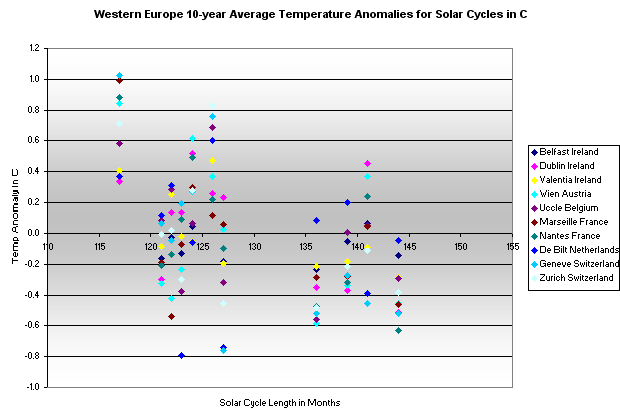
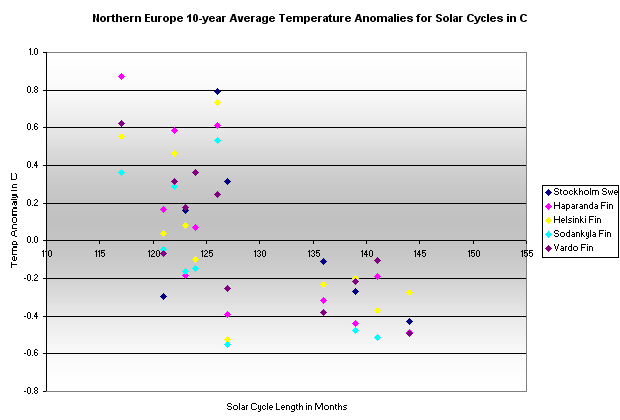
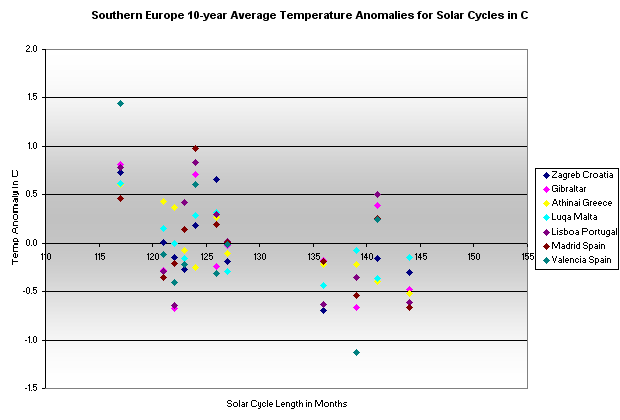
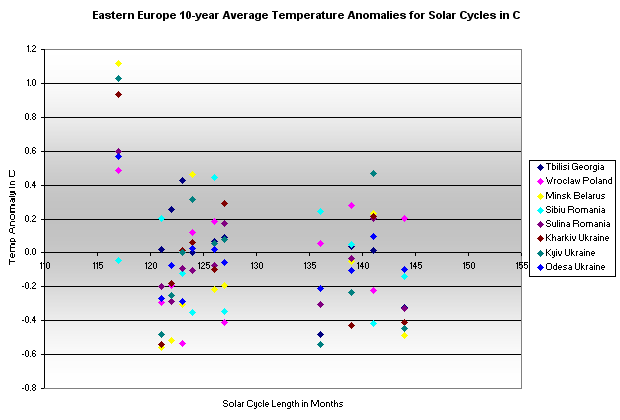
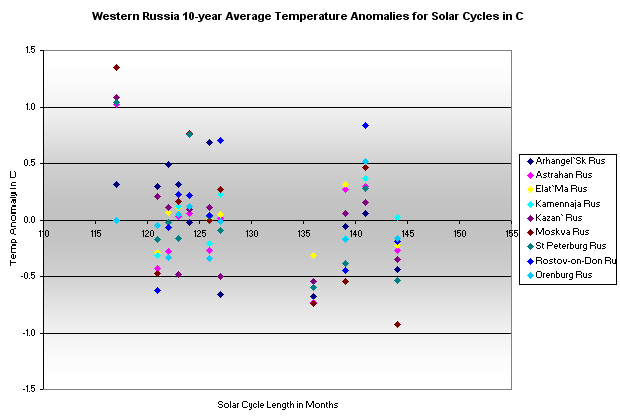
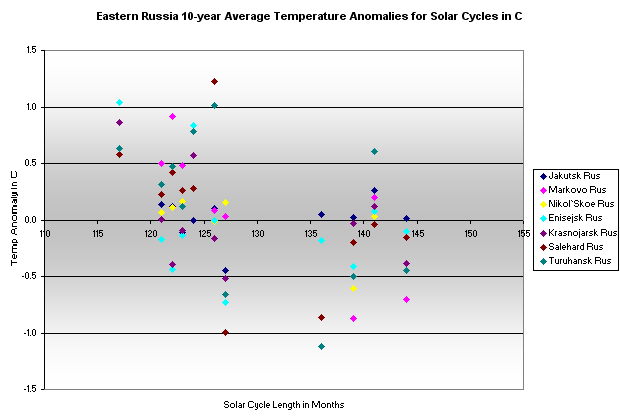
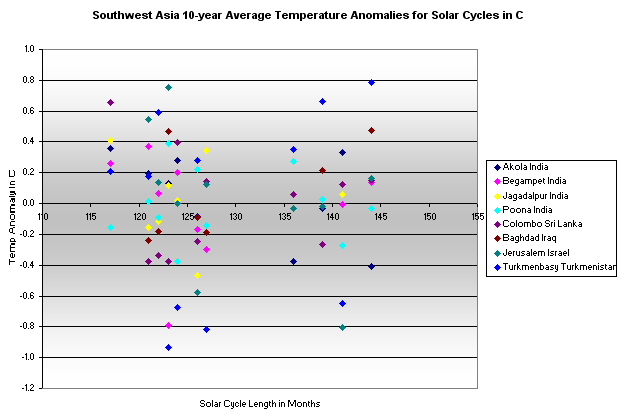
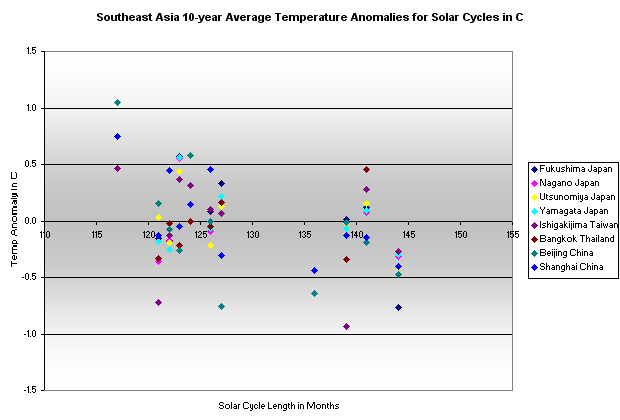
The charts in this web page set plot the relationship of the solar sun spot cycle lengths and the 10-year average temperature anomalies in the GISS raw data set. The temperature values are averages over the 10-year span centered on the next solar cycle maximum, assuming that much of a lag from the effects of a solar cycle (where a shorter cycle presumably adds more heat to the earth's oceans while a longer cycle presumably adds less heat). For each chart, if there were a tight correlation between solar cycle length and temperature trends then the averages would plot from the upper left (where shorter cycles are warmer) to the lower right (where the longer cycles are cooler). Around the world some locations follow this relationship closer than do others. Locations in the upper Northern Hemisphere seem to conform better than locations elsewhere.
Here are the 10-year average temperature anomalies for these regions compared to the sun spot cycle length (with the 10-year average centered on the month of the next cycle's maximum sun spot count).
The following graphs are for different regions of the world, with them in roughly a West to East order around a globe, with a sequence for each hemisphere. The start is at Australia for the Southern hemisphere toward Africa and then starting again with Canada for the Northern hemisphere toward Europe and ending in Asia. The regions of the world are presented in this order:
Australia, New Zealand, Pacific Ocean, Poles (north and south), South America, Africa.
The United States of America has its own topic.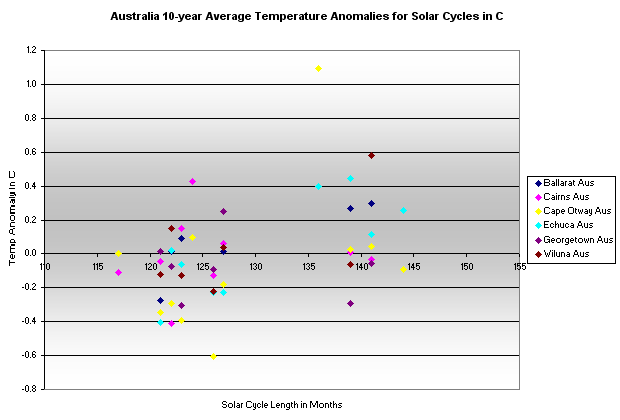
Northern Hemisphere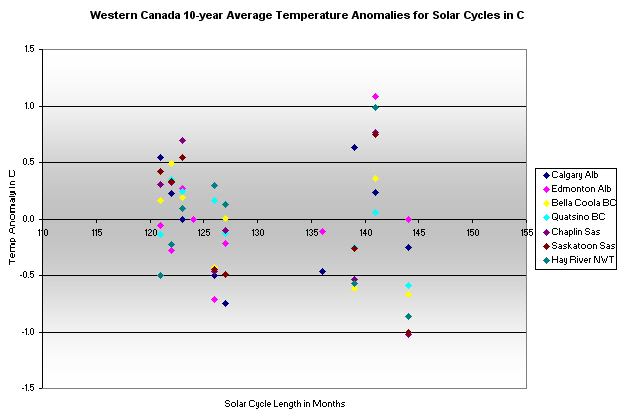
created - Jan. 2011
last change - 01/14/2011
Here is the list of topics in this AGW Topic Group .
All Topic Groups are available by selecting More TG.
All topics in the site are in the Site Map, where each Topic Group has its topics indented below it.
Ctrl + for zoom in; Ctrl - for zoom out ; Ctrl 0 for no zoom;
triple-tap for zoom to fit; pinch for zoom change; pinched for no zoom